CME COMEX Gold Options · Dealer Gamma Exposure (GEX) · Updated after each CME settlement

COMEX Gold Options — Gamma Levels

Where options dealers have to buy or sell gold to stay hedged. Four levels come out of it: resistance, support, a regime switch and a price magnet. This page shows them, what they mean today, and the charts behind them.


MetaTrader 5 MT5 EA Setup NinjaTrader 8 NinjaTrader 8
01

Today’s gamma levels TradingView inputs

The four levels traders plot on their charts. They sit where options dealers hold the most gamma, so price often reacts there. Each card shows how far it is from the latest CME settle.

● DEALER LONG GAMMA — Price in controlled range. Mean-reversion tendency. Levels act as magnets.
CALL WALL
LEVEL 1 RESISTANCE
unavailable
Institutional Resistance — Highest +GEX • TV Level 1
PUT WALL
LEVEL 2 SUPPORT
unavailable
Institutional Support — Highest -GEX • TV Level 2
GAMMA FLIP
LEVEL 3 FLIP
unavailable
Regime boundary — Above=calm, Below=volatile • TV Level 3
HIGH OI STRIKE
LEVEL 4 MAGNET
unavailable
Peak open interest magnet (active ±3σ) • TV Level 4
Current Spot: unavailable
Call Wall Dist: unavailable
Put Wall Dist: unavailable
Flip Dist: unavailable
02

Where price sits

Today’s levels on one line, with the zones where dealer hedging tends to speed moves up (below the flip) or calm them down (above it), and the expected-move ranges.

Price map · levels around the CME settle
----
Short-gamma zone (moves accelerate) Long-gamma zone (moves dampen) Expected move (1 day / to expiry)
Levels from top to bottom
  • Loading levels…
Today in plain English
  • ●Loading today’s read…
Since the previous session
03

Expected move & AI read

How far the options market expects gold to move (one standard deviation), and an AI summary of today’s setup for Pro members.

EXPECTED VOLATILITY RANGE 1-SIGMA (16% IV)
MACRO MOVE
unavailable
unavailable
INTRADAY SESSION MOVE (1-DAY)
unavailable
unavailable
------
Gold band = 1-day move. Blue band = move expected by expiry. White line = settle.
AI SMART ADVISOR
◆ NEUTRAL
Pro Access Required
Institutional-grade AI commentary synthesized from the daily CME gamma structure and positioning flows.
Live Spot: -- · Confidence: --%
AI advisor loading analysis...
Evaluating COMEX gold dealer positioning and gamma strike concentration...
Key Level: --
--
Generated via Gemini AI · Educational analysis only, not financial advice.
🔒 FREE BENCHMARK MODE • SIMULATED CME DATA Today's CME gamma levels and the live price stream are Pro only.
DOUBLE BLACK FRIDAY: DOUBLE THE TIME, HALF THE PRICE — 6 MONTHS $49 · 2 YEARS $99 · LIFETIME $100 OFF Ends in   (December 1, 23:59 UTC). This is our Black Friday price. It will not go lower on November 27. It goes back to normal on December 2.
STOP TRADING ON DELAYED BENCHMARKS: UNLOCK TODAY'S CME GAMMA WALLS ON THE LIVE GOLD PRICE Institutional dealers are actively hedging. Unlock today's CME call wall, put wall and gamma flip, the live gold price stream, TradingView HUD, MT5 EA & NinjaTrader 8 Indicator with 100% one-time passes.
04

Live price chart with gamma levels

Gold candles with today’s levels drawn on. Pro streams live prices and every timeframe; free accounts see a frozen sample.

GOLD (XAU/USD) · GAMMA LEVELS
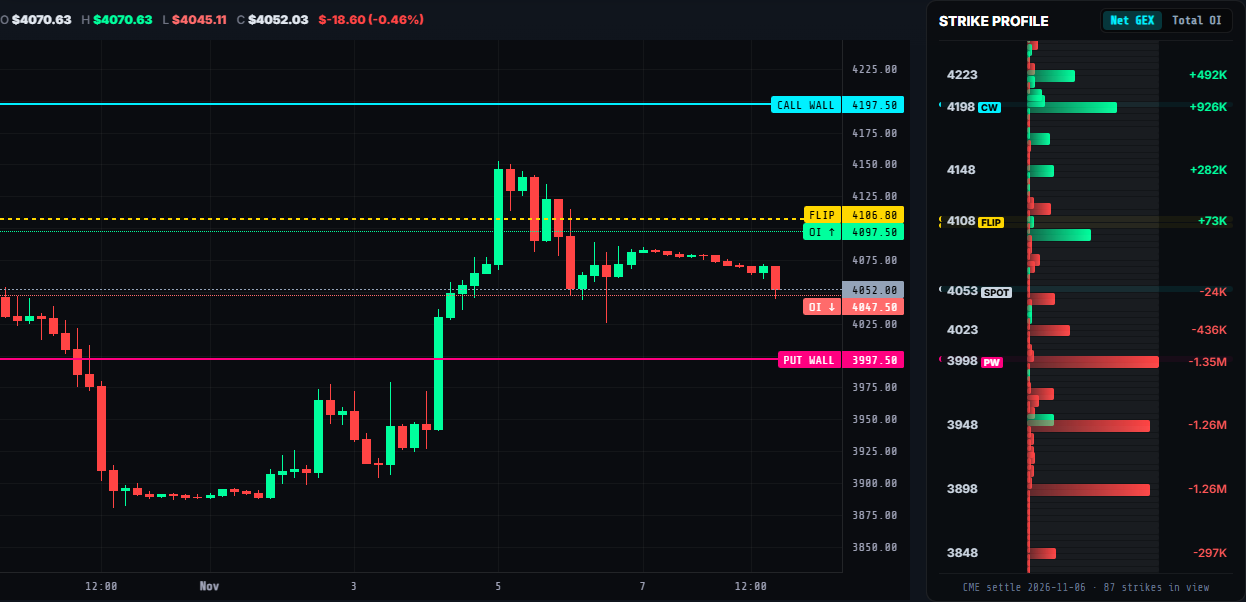
🔒 FROZEN BENCHMARK: $4107.90
Levels from CME settle -- ($--) Spot = futures unavailable Candles to --
O -- H -- L -- C -- --
Frozen sample of the Pro gold chart: 4H candles with call wall, put wall, gamma flip and OI levels, and the strike profile beside it (CME settle 2026-11-06)
🔒 FROZEN BENCHMARK CHART
Subscribe to Pro to unlock real-time streaming CME Gold candles & live tick updates
Loading COMEX Gold Futures Candles...
05

Open interest & gamma by strike

Calls and puts at the 30 strikes closest to the price. The tallest bars are where dealer hedging is concentrated.

Gamma Exposure by Strike – GC (OGZ26 Dec 2026)

30 STRIKES AROUND SPOT · dealer gamma at each strike, puts left, calls right
Put GEX Call GEX
Call Wall unavailable Spot unavailable Gamma Flip unavailable Put Wall unavailable
🔒 FROZEN BENCHMARK GEX CHART
Subscribe to Pro to unlock today's CME Gold gamma exposure & the live gold price
06

Gamma exposure across all strikes

The full profile of dealer gamma with the net curve. Where the net curve crosses zero is the gamma flip.

⚡ Gamma Exposure (GEX) Distribution Across Active Strikes

Bilateral Call & Put dealer hedging exposure profile across strikes with spot, flip, and peak OI corridor anchors
🔒 FROZEN BENCHMARK VALUES IN NET GEX / 1% MOVE OGZ26
Call GEX (+)
Put GEX (-)
Net Curve
All Strikes
🔒 FROZEN BENCHMARK GEX PROFILE
Subscribe to Pro to unlock today's CME Gold gamma exposure & the live gold price
07

Strike table

The numbers behind the charts: gamma and open interest per strike, sortable by any column.

Data & Methodology Disclaimer: Gamma levels are calculated from official CME COMEX Gold options settlement data (Product 437 / 192 OOF). Call Wall is defined as Resistance Ceiling (strikes ≥ Spot) and Put Wall as Support Floor (strikes ≤ Spot) to isolate directional dealer hedging magnet zones. Updated daily after official CME settlement release. IV assumption: 16% annualized (v1 baseline — live IV in v2). Analytical data only, not financial advice.
⬡ AurumGamma
Authenticate to Access Live Terminal & Dashboard Data
Or with Email
Black Friday until December 1: 2 years $99 · Lifetime $199🔥 Limited Time Launch Offer — 100% Free Public Access